import numpy as np
import matplotlib.pyplot as plt
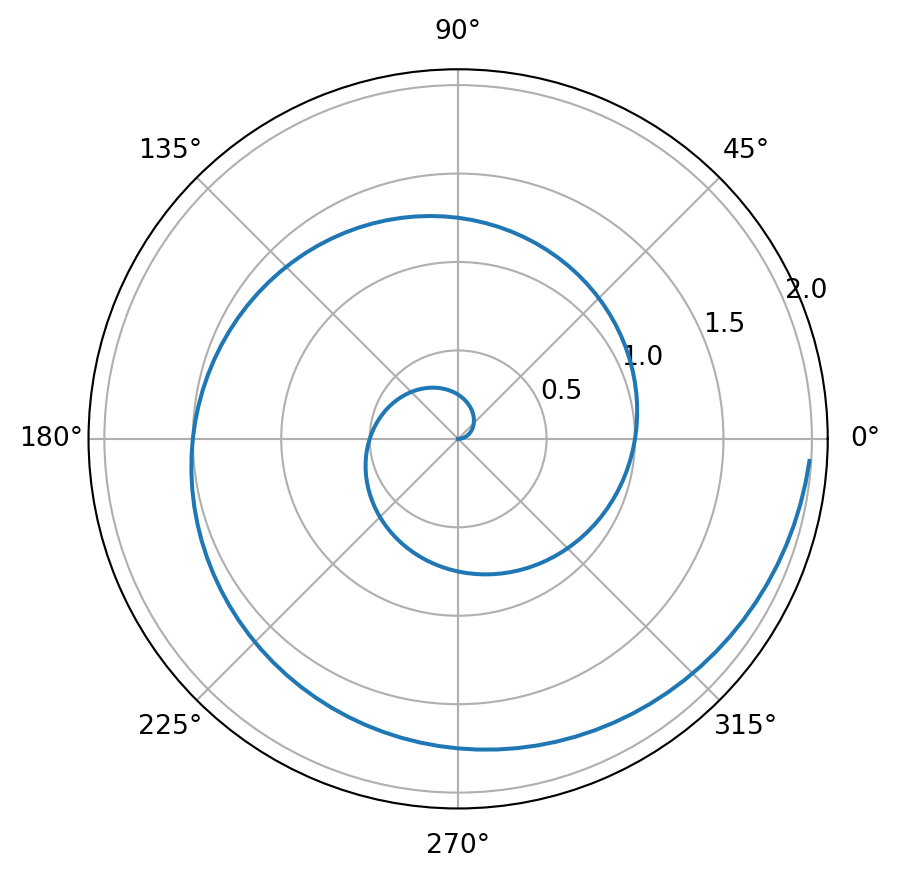
r = np.arange(0, 2, 0.01)
theta = 2 * np.pi * r
fig, ax = plt.subplots(subplot_kw={"projection": "polar"})
ax.plot(theta, r)
ax.set_rticks([0.5, 1, 1.5, 2])
ax.grid(True)
plt.show()
import numpy as np import matplotlib.pyplot as plt r = np.arange( 0 , 2 , 0.01 ) theta = 2 * np.pi * r fig, ax = plt.subplots(subplot_kw = { "projection" : "polar" }) ax.plot(theta, r) ax.set_rticks([ 0.5 , 1 , 1.5 , 2 ]) ax.grid( True ) plt.show()